
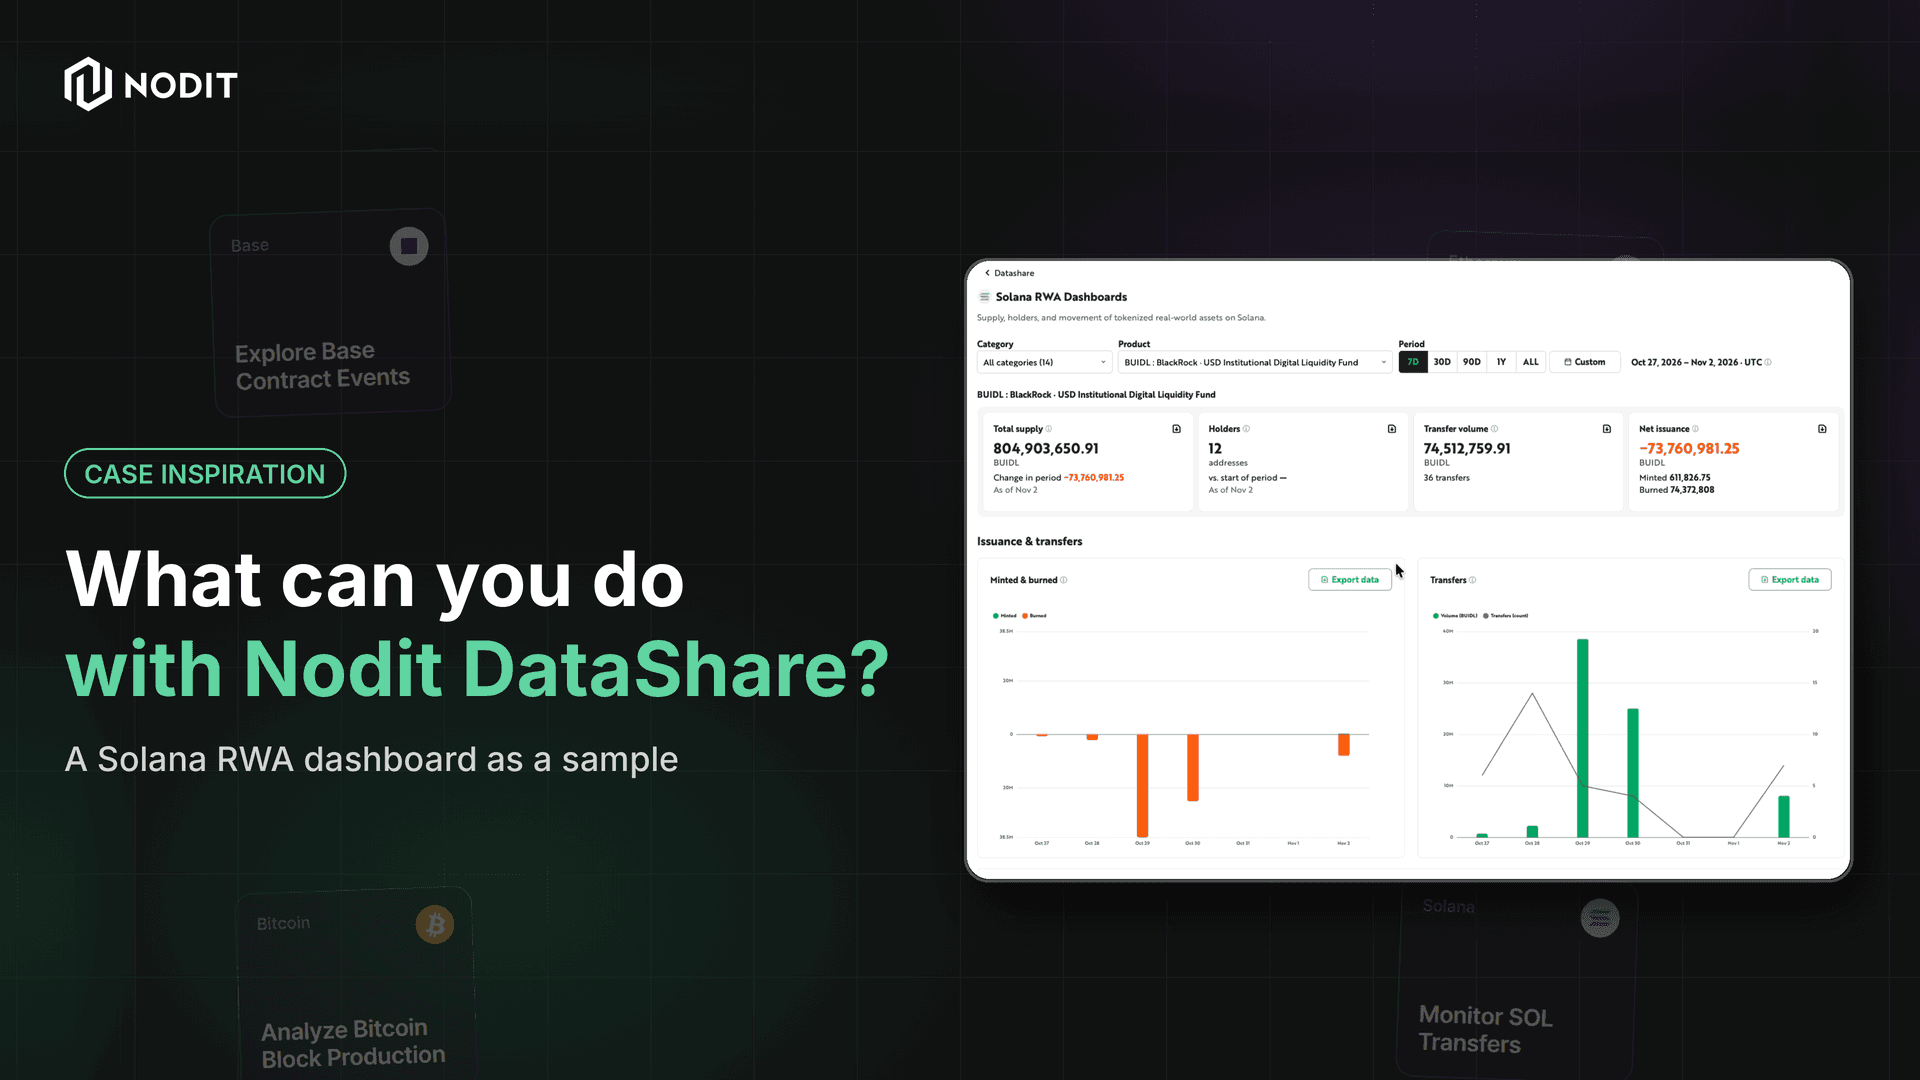
How Datashare helps operations, custody, and risk teams access the records they need to review activity, investigate differences, and make timely decisions.
TL;DR
- DataShare provides onchain records for RWA operations and analysis. The Solana RWA Dashboard illustrates how those records can support day-to-day workflows.
- Three analyses show the data in practice: mint and burn activity, address balance changes, and holding concentration across 14 selected products.
- Supported source records can be exported to S3 as Parquet for analysis alongside internal data. Each account includes 3 free exports, covering up to 7 days each within the past 3 months.
- Custom datasets can address requirements beyond the available templates, with scope and delivery discussed around the intended analysis.
Introduction
At month end, a tokenized fund position may be reported by the custodian, recorded in fund accounting, and visible onchain. When those figures differ, someone has to determine which records explain the gap, and do so before the reporting deadline.
That task is becoming more common. In its July 2026 overview, the Solana Foundation reported $3.7 billion in non stablecoin RWA value on Solana as of late July, held by approximately 313,000 holders across tokenized Treasuries, bonds, equities, private credit, and commodities. Activity is growing at a similar pace: on November 2, 2026, $657 million in tokenized stocks traded on Solana in a single day, more than double any other day since September, according to Blockworks data shared by Solana.
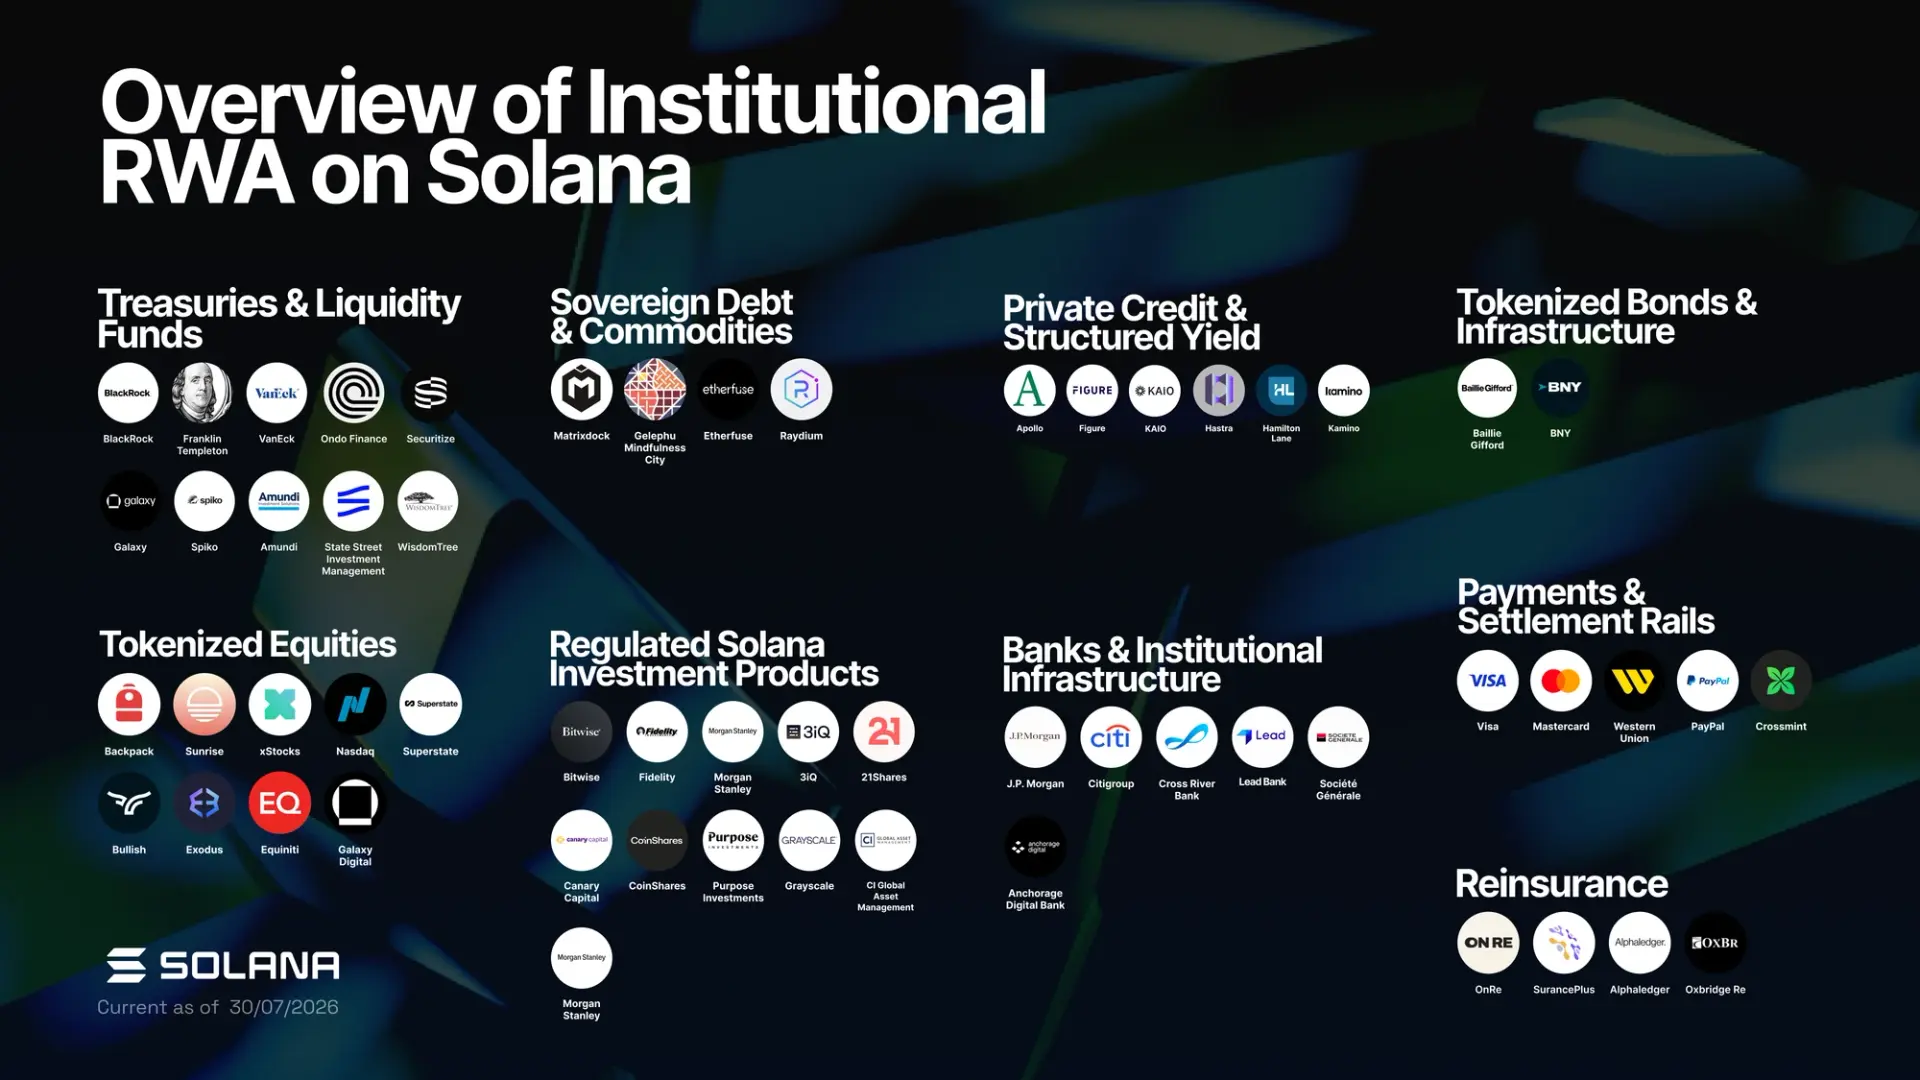
Embed: Solana on X, Nov 4, 2026
More products and more activity produce more onchain data, distributed across a growing number of issuers, tokens, and addresses. For teams responsible for issuance, custody, and risk, the challenge is no longer whether the data exists. It is locating the specific records that answer an operational question, and doing so in time to act on them.
In an earlier article, we examined the operational challenge of keeping internal books and onchain records aligned. Here, we look at how Datashare can support that work through three examples from the Nodit Solana RWA Dashboard.
Case Inspiration: Solana RWA Dashboard
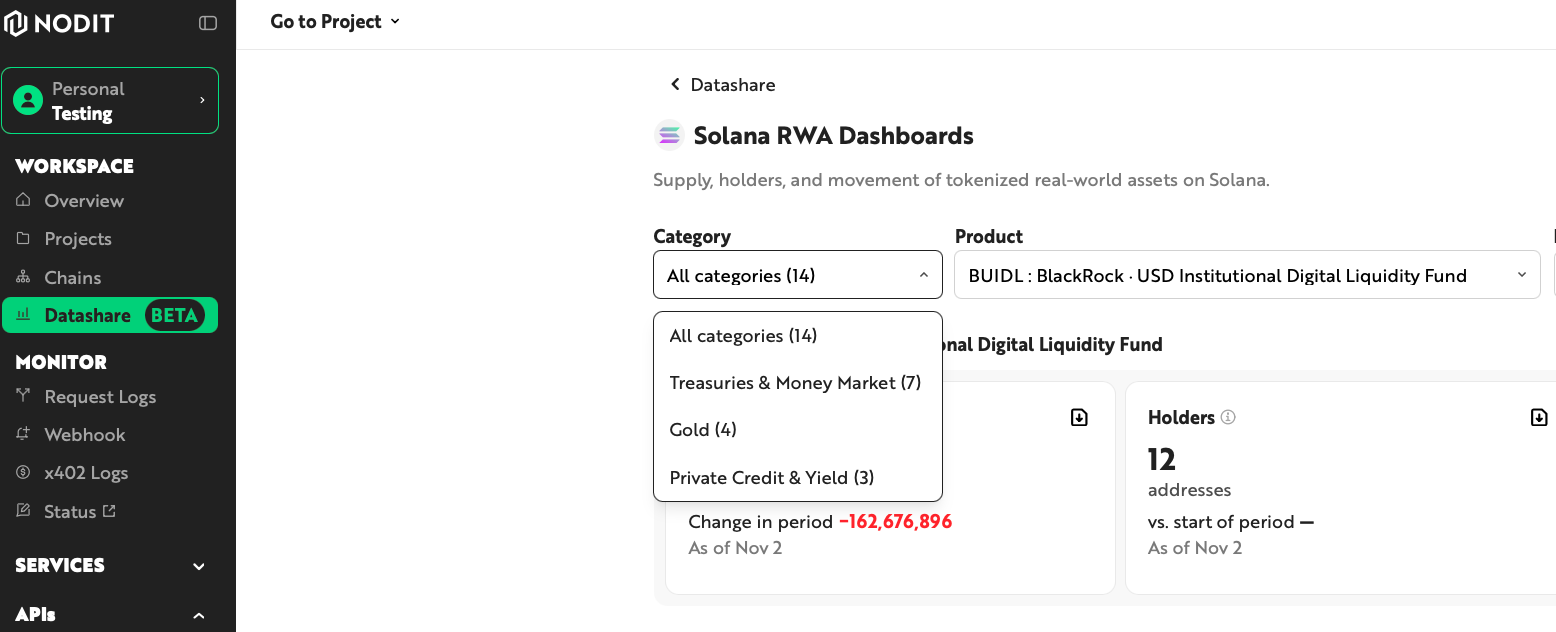
The dashboard covers 14 selected products across Treasuries & Money Market, Gold, and Private Credit & Yield. It illustrates how Datashare records can be used to examine supply changes, review address balances, and assess holding concentration. The goal is to help teams move from identifying a change to reviewing the evidence needed for a decision.
See the approach in practice
A short walkthrough: exploring a product's activity on the dashboard and exporting supported records to S3.
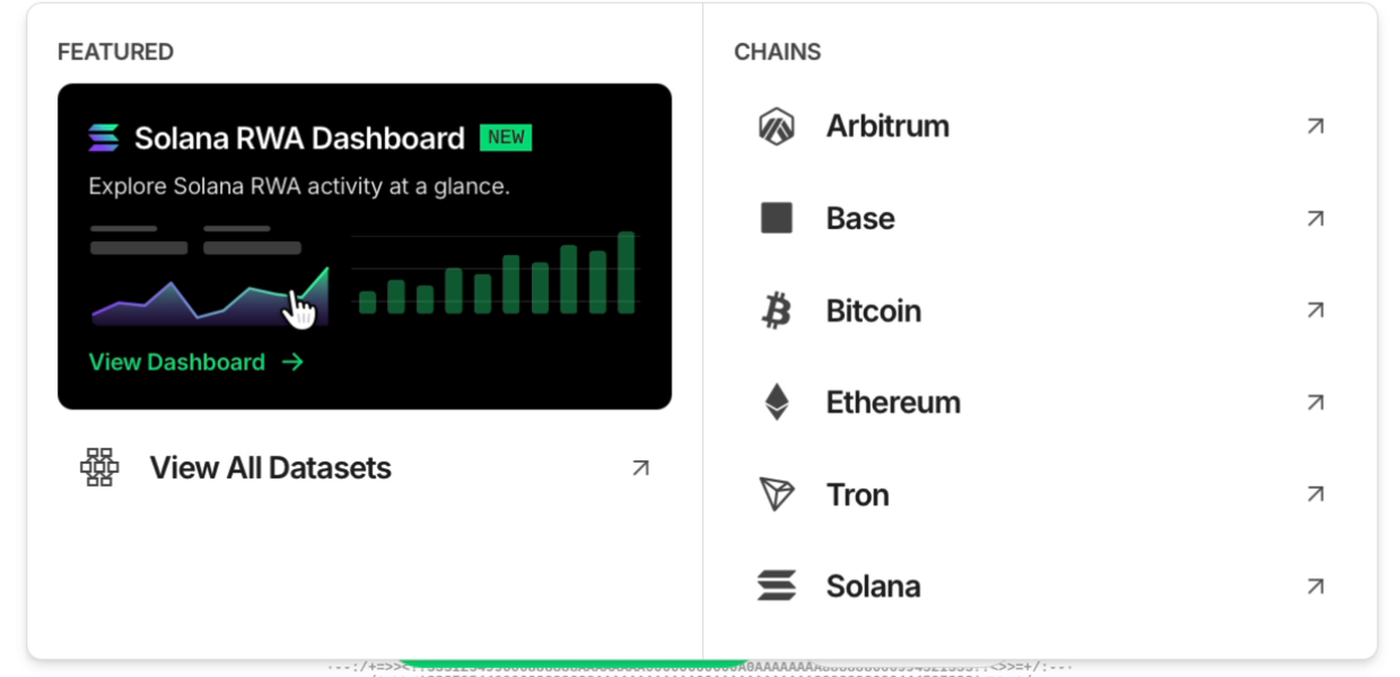
The Solana RWA Dashboard is available from the Datasets menu on nodit.io.
1. Review mint and burn activity against internal records
An issuance and operations team need to check whether the mint and burn activity recorded onchain corresponds to its internal issuance and redemption records. When something differs, a daily total helps locate the period to investigate; the transaction details support the next step.
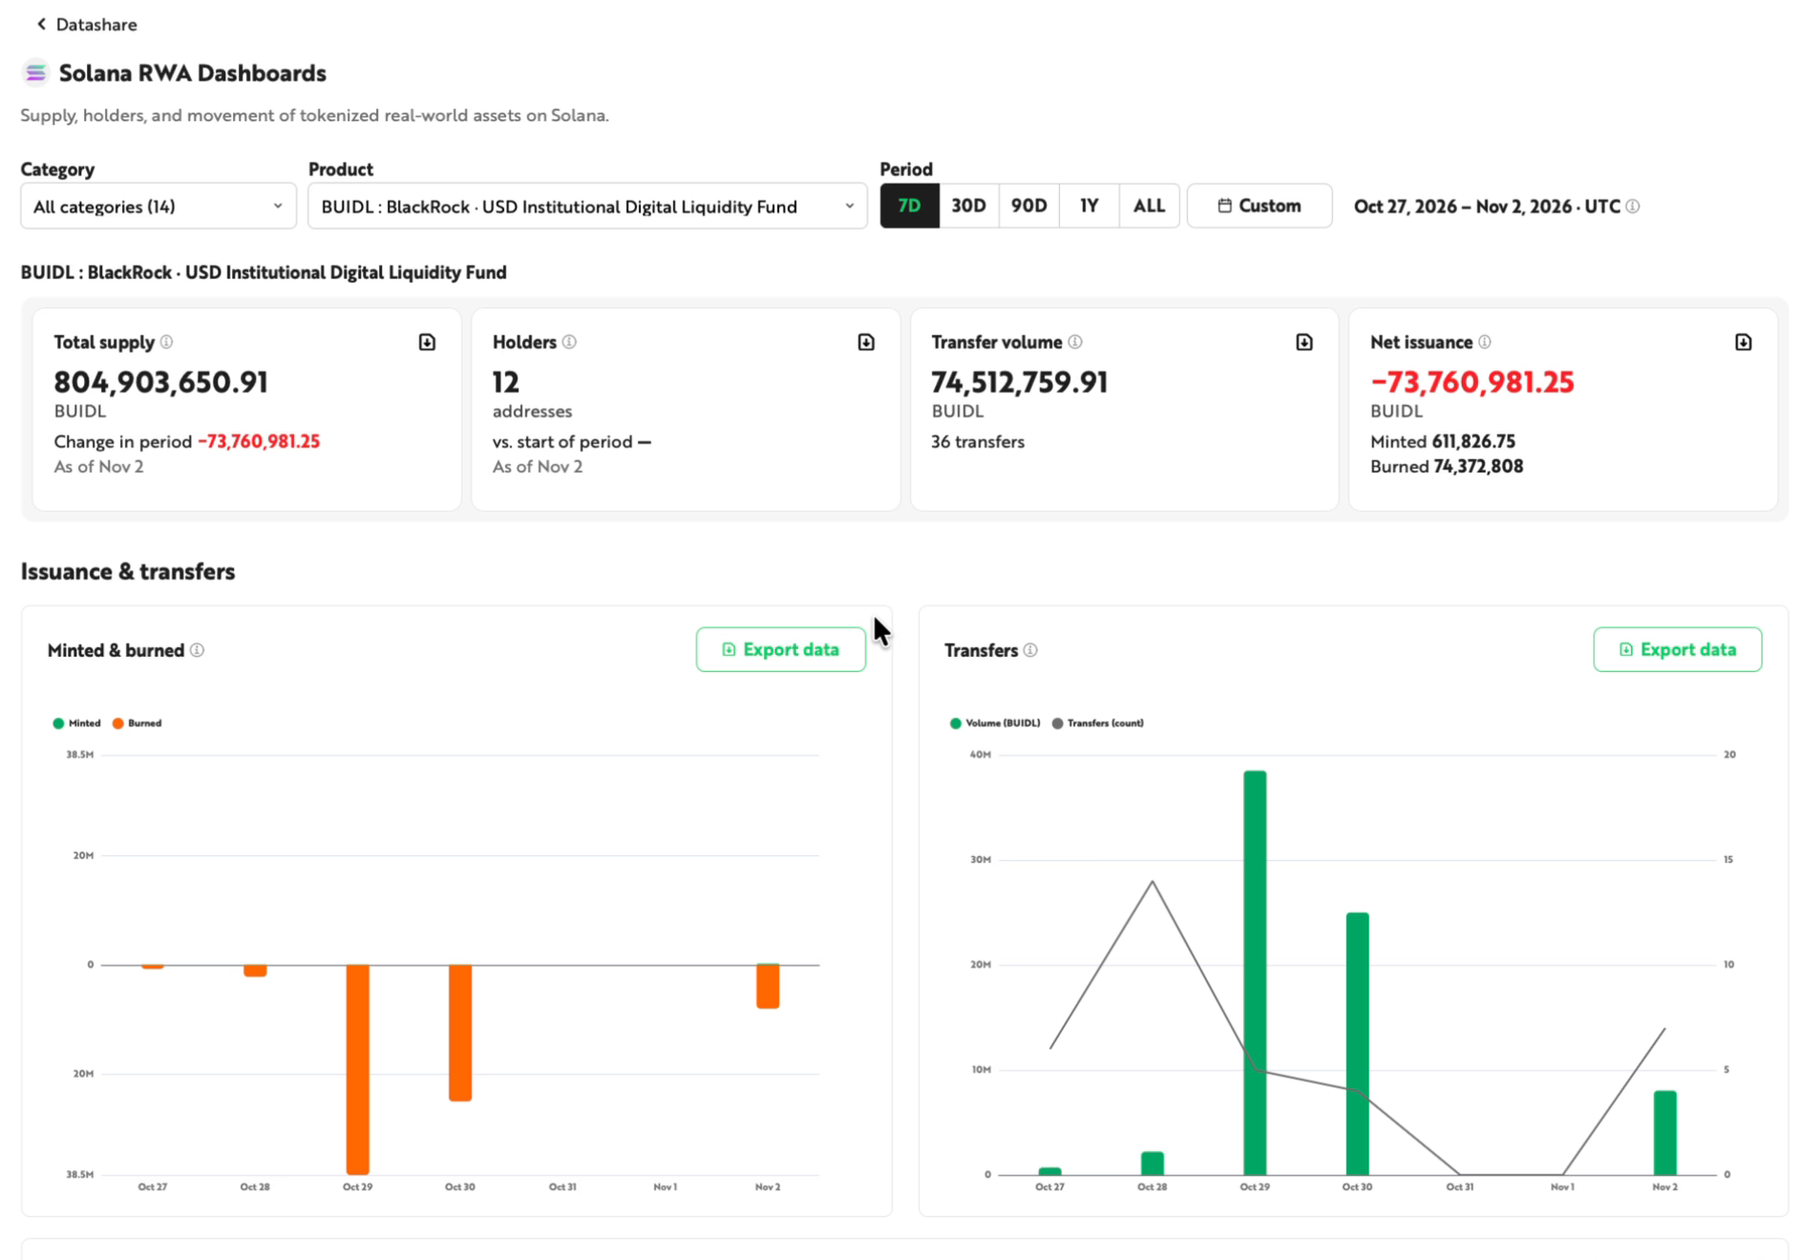
The dashboard uses mint and burn events for a product’s Solana mint address to show daily activity and calculate net supply changes over a selected period. A transaction table provides the individual records behind those totals.
Example view: supply, address count, transfer volume, and daily mint and burn activity for a selected product and period.
Issuance and operations teams can use this view to identify activity that needs closer attention, then compare the relevant transactions with internal instructions. It provides a focused starting point for investigation, with the supporting records available for review.
2. Understand how an address’s position changed
A closing balance tells a team where a position stands. To understand how it got there, the team also needs the opening balance and the activity recorded during the period.
This is particularly useful when fund operations or custody teams are reviewing a position before a reporting deadline.
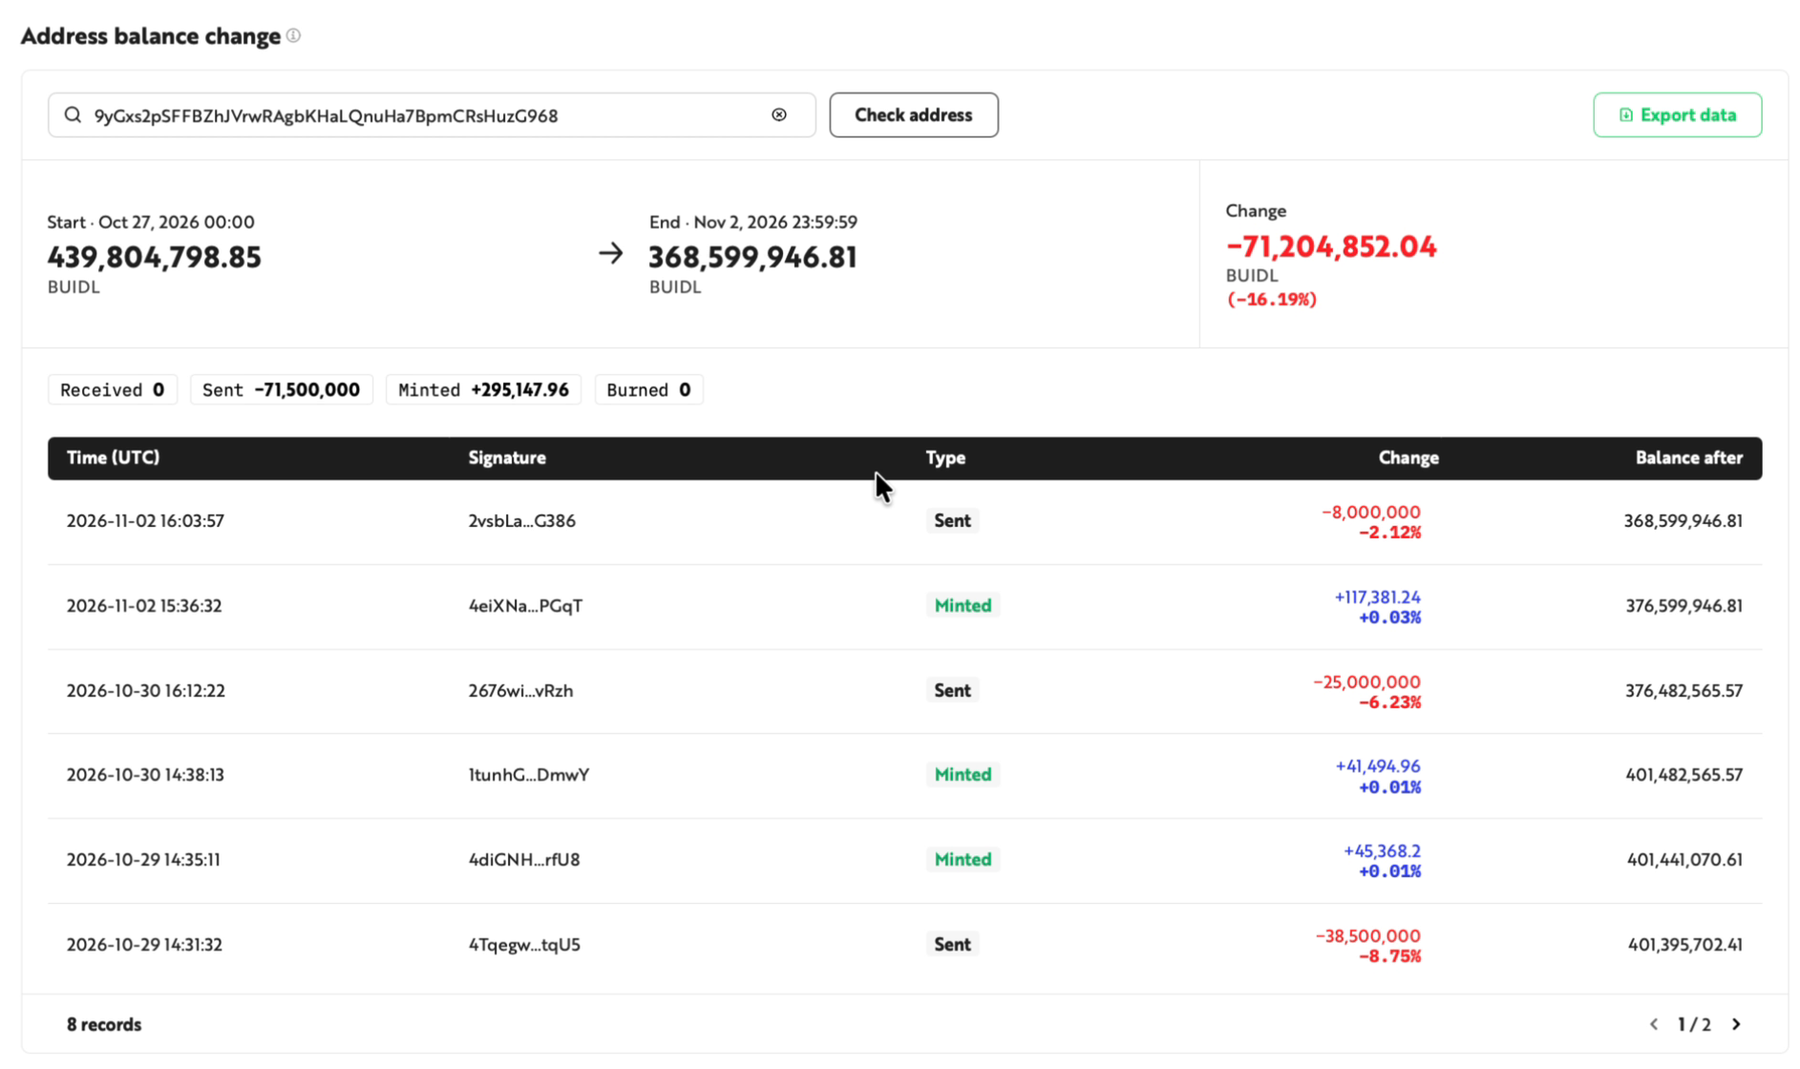
Using balance change and token transfer records for a selected address and date range, the dashboard presents opening and closing balances alongside recorded transfers, mints, and burns.
Example view: opening and closing balances, with activity recorded during the selected period.
Teams can use these records to investigate a balance movement and compare the relevant activity with their internal ledger. Having the period’s records together helps them focus the review on the transactions that may explain a difference.
3. Identify concentration that warrants further review
Risk and product teams may want to understand whether a large share of a product’s supply sits in a small number of addresses. That information can help them decide where a more detailed review is needed.
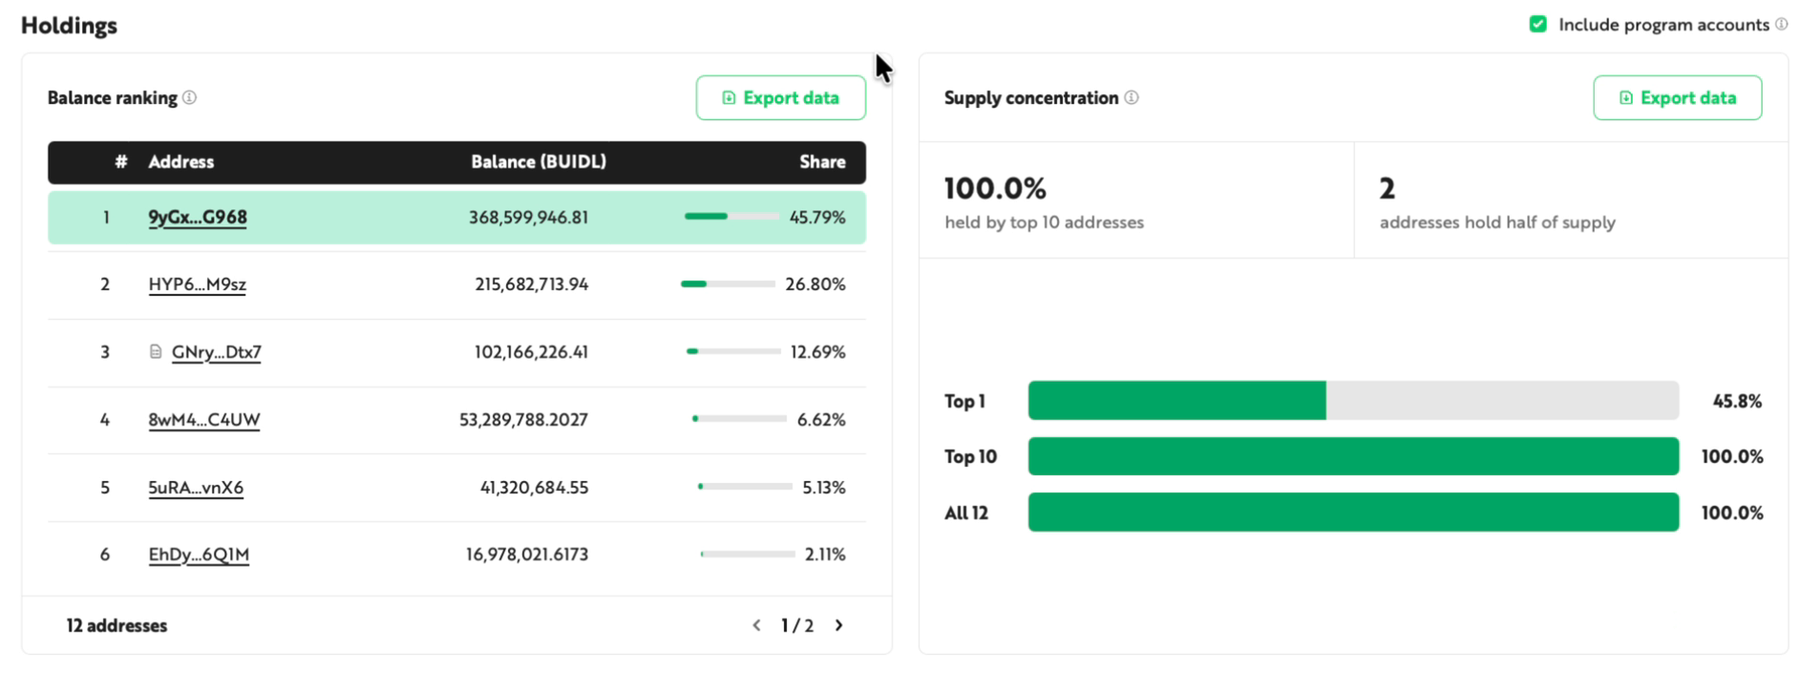
The dashboard ranks addresses by balance and shows the share of supply held by the top 1 and top 10 addresses. Producing this analysis requires a complete balance view at the reporting date and additional processing.
Example view: address-level holdings and supply concentration.
Concentration provides a starting point for further assessment. Teams still need context about the addresses involved: one institution may use several addresses, while a custodian may hold assets for multiple clients in a single address. Address-level holdings should therefore be considered alongside internal ownership information and other relevant records.
Bring the records into your team’s workflow
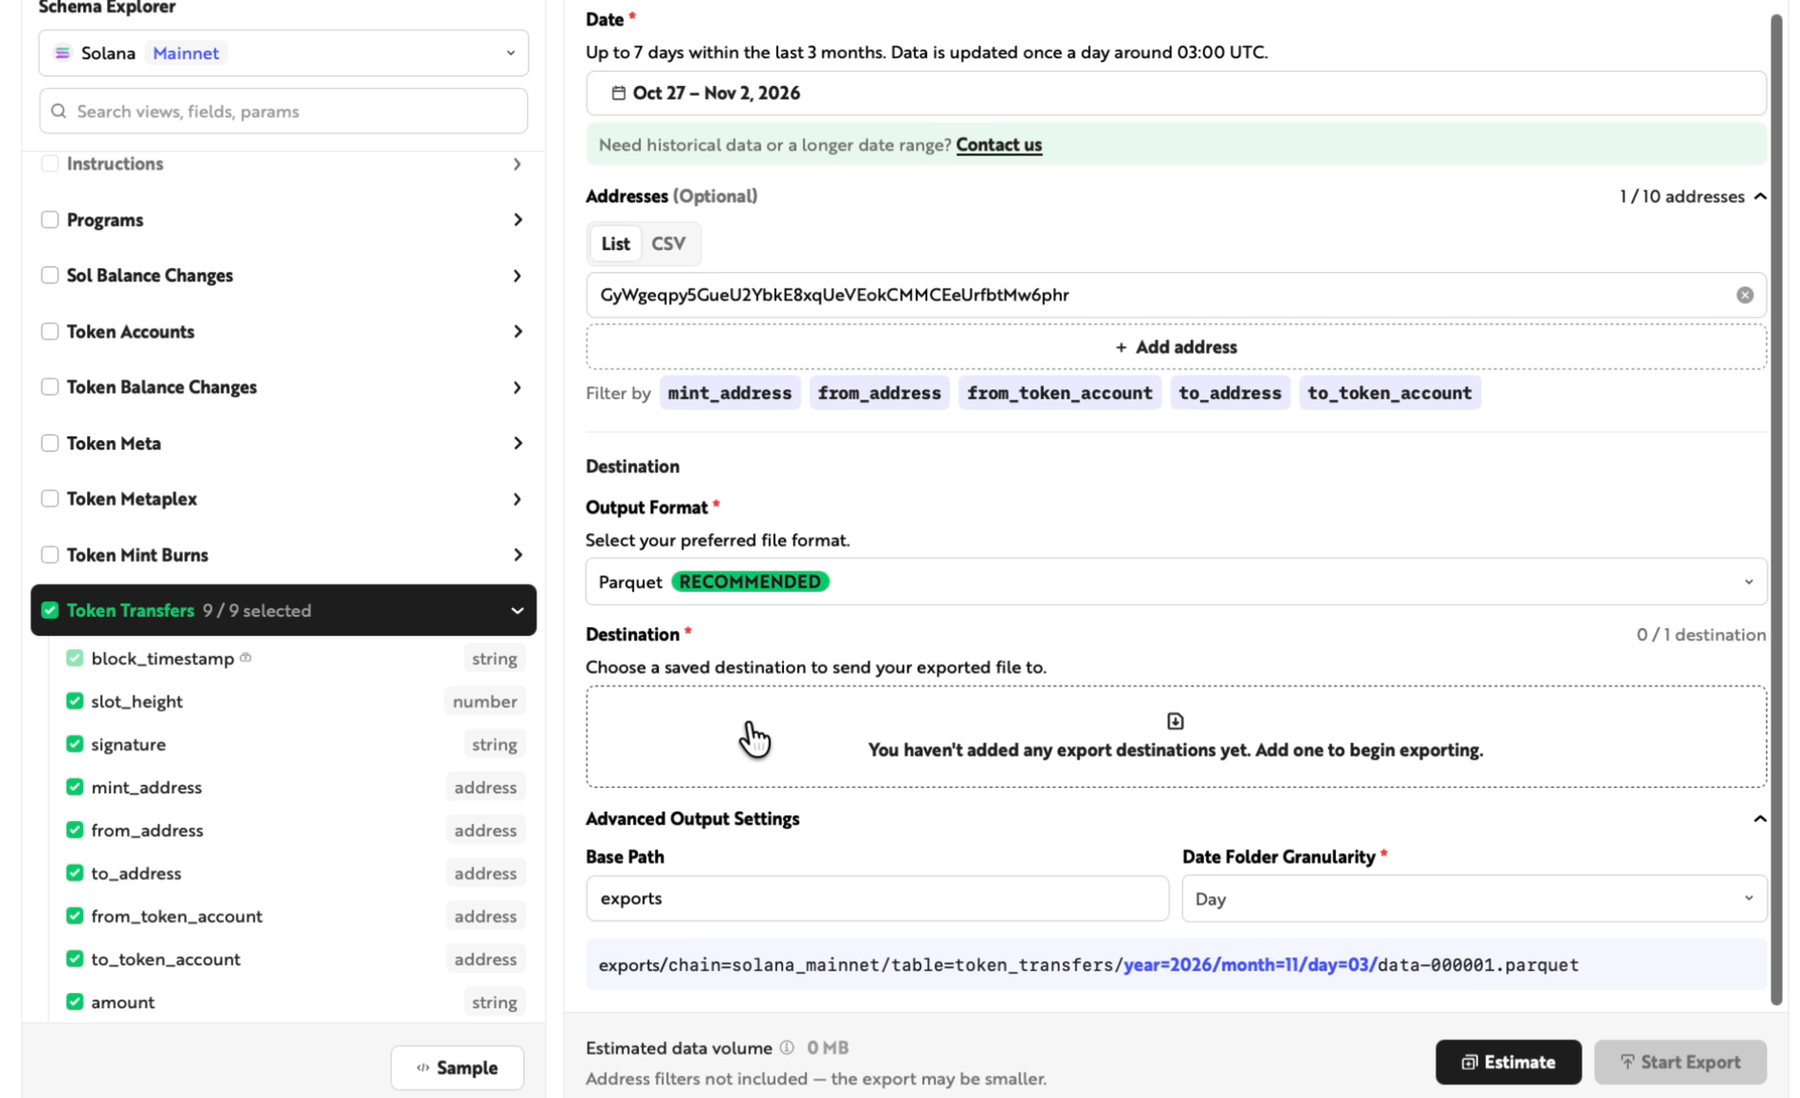
Your team may need a monthly position report, a daily issuance review, or a consolidated view across the addresses it manages. The starting point is the same: define the question, identify the products and addresses in scope, and determine the reporting period required.
To evaluate the underlying data, each account includes 3 free exports, each covering up to 7 days within the past 3 months. On supported dashboard charts, Export data opens Create Export with the relevant filters prefilled. Once an S3 destination is configured, the selected records are delivered as Parquet files for use with your existing tools.
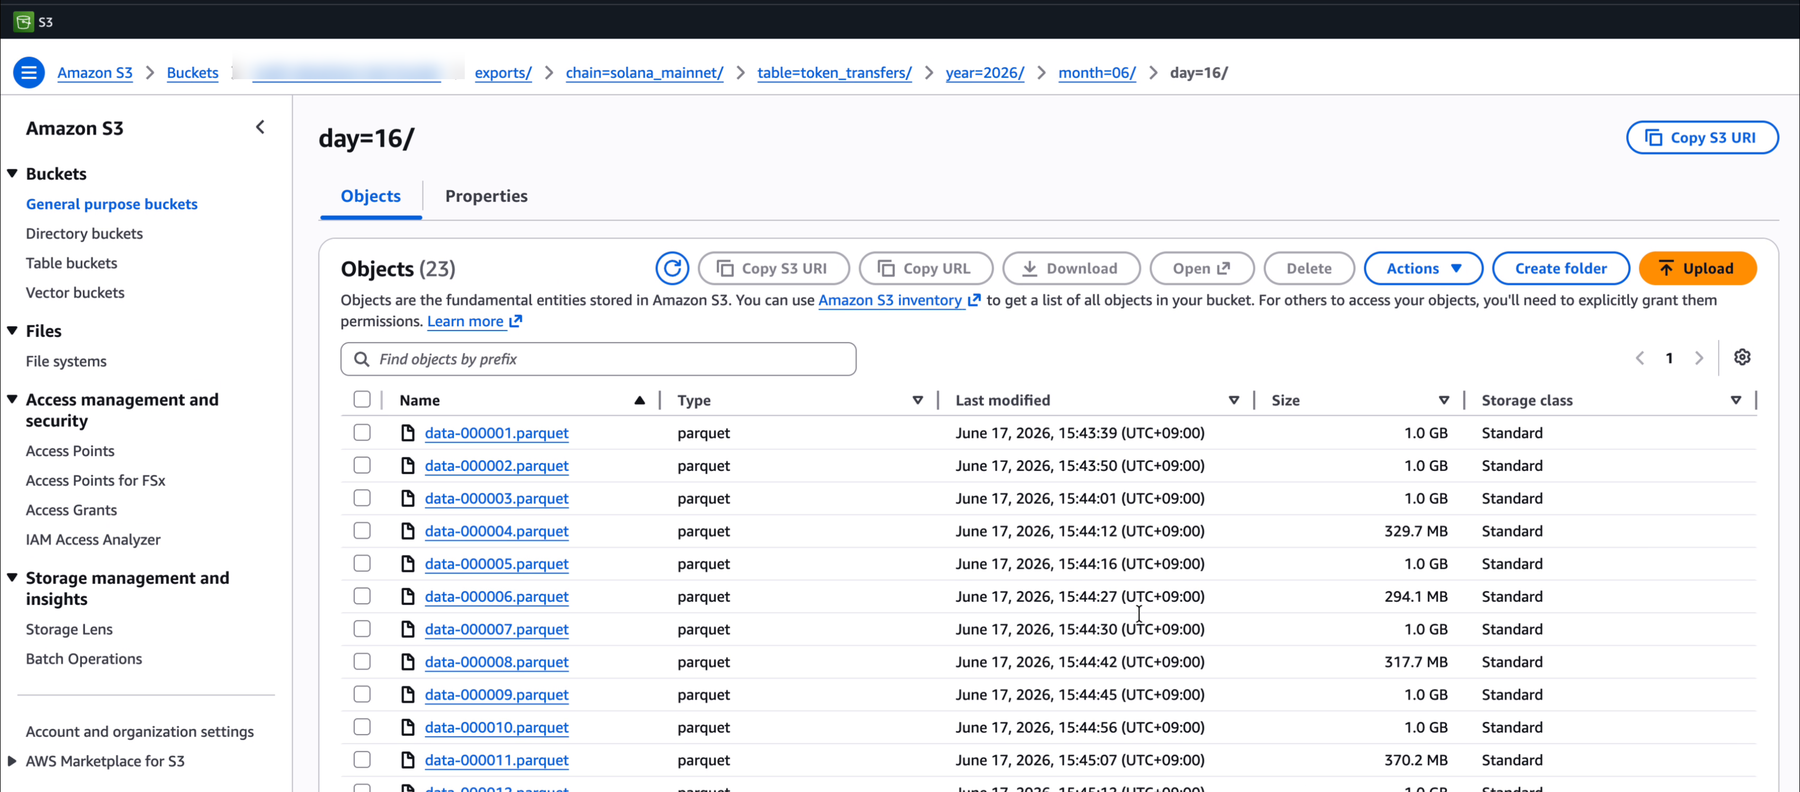
Exports contain supported source records rather than the dashboard’s calculated metrics. Your team can use those records to develop calculations, prepare reports, or compare activity with internal data. Analyses that require a complete historical position or additional processing may need broader coverage.
If you have a specific requirement in mind, share the intended analysis, the coverage you need, and the expected output through Request Custom Dataset. We can then discuss the data scope and delivery requirements with you.
Explore the RWA example · Explore available datasets · Discuss your data requirements
About Nodit
Nodit is an enterprise-grade blockchain infrastructure platform providing reliable node access and consistent on-chain data for digital asset services. Across 70+ networks, Nodit combines managed node infrastructure, standardized data processing and delivery, DataShare with specialized blockchain datasets, and Validator-as-a-Service (VaaS) to support production-scale operations, institutional analytics, and AI applications.
Backed by SOC 2 Type II and proven experience with major regulated exchanges worldwide, Nodit provides the complete on-chain data pipeline that powers the digital asset economy.